An updated map of a very large flow
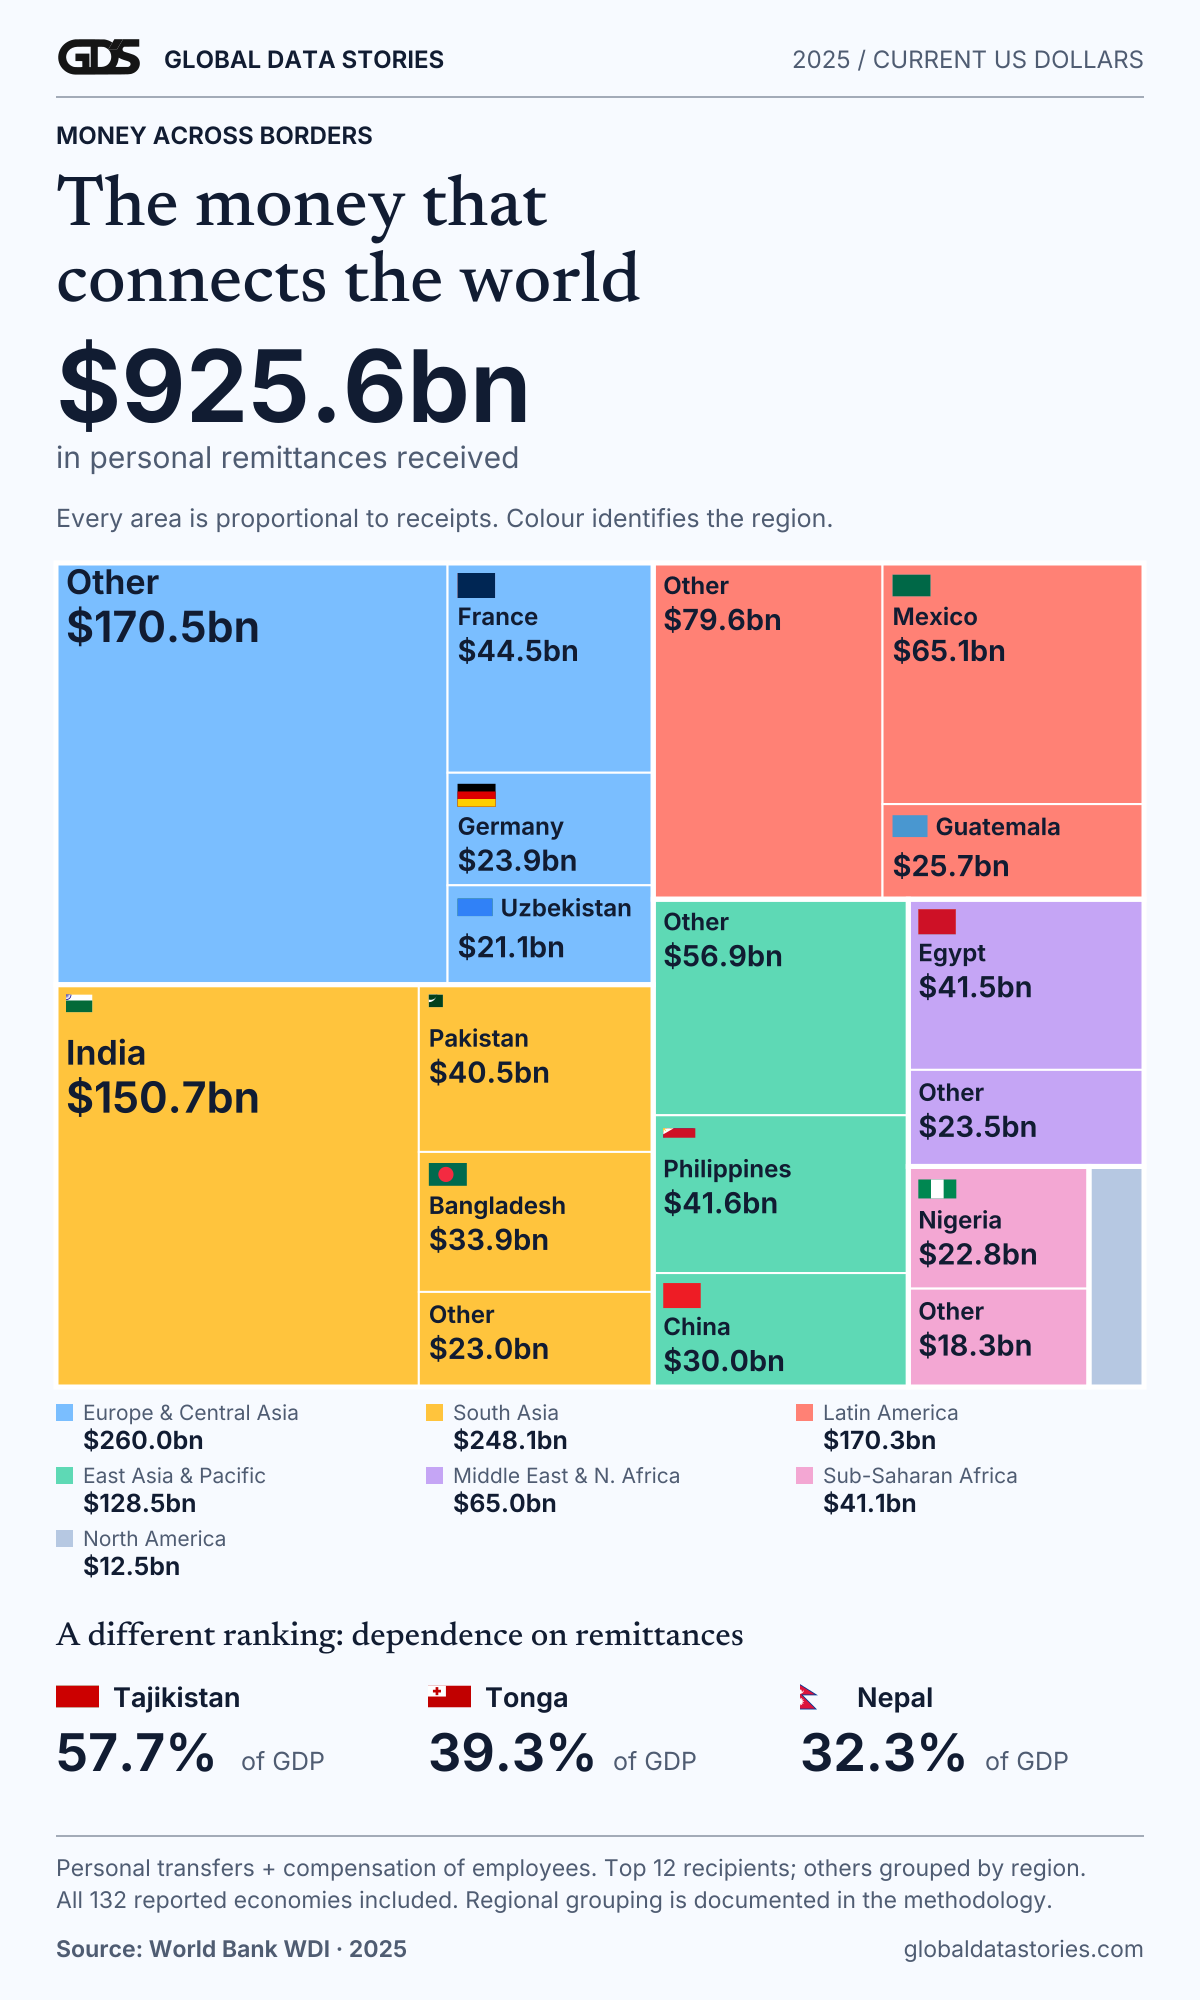
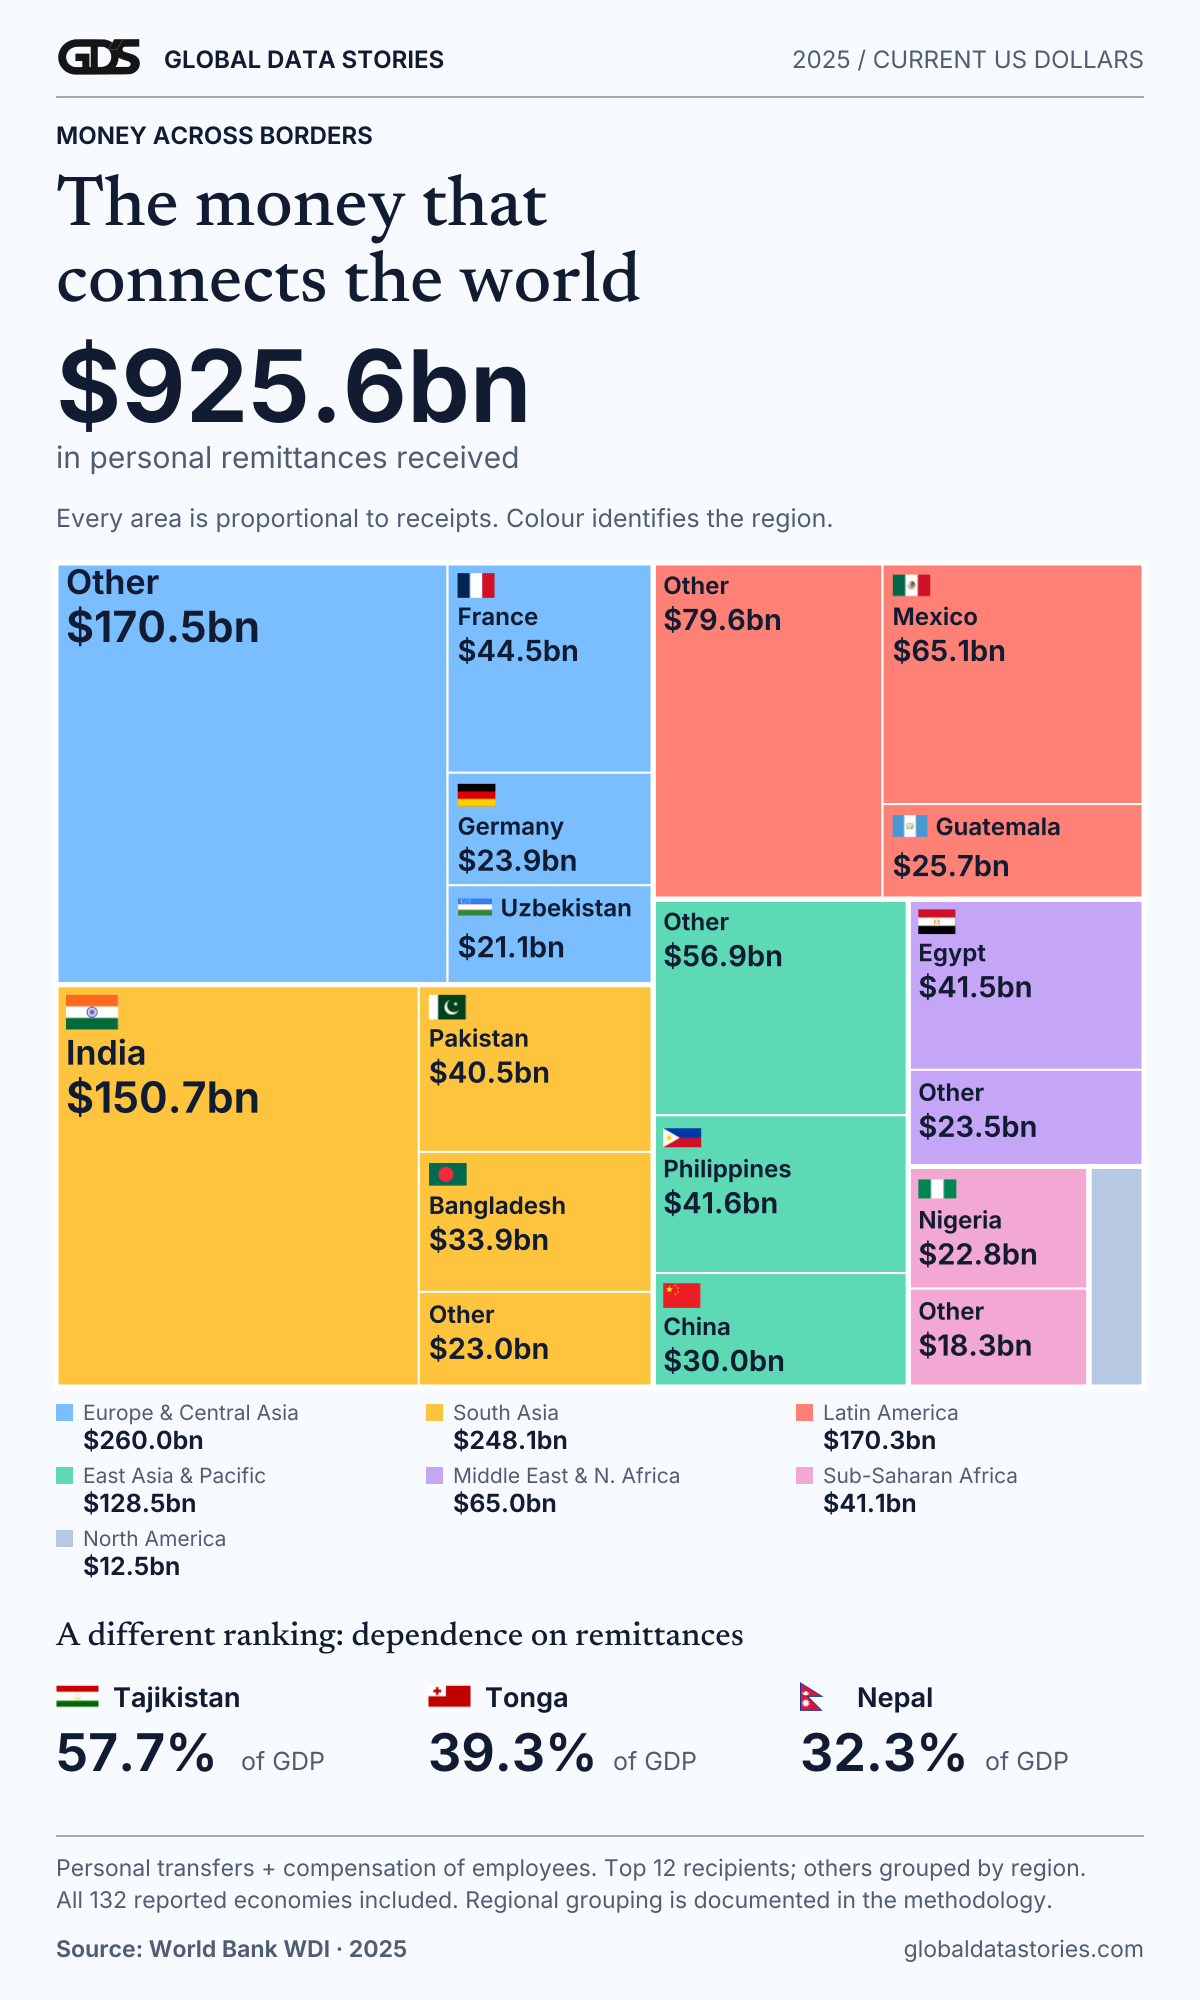
The World Bank’s current series records $925.553 billion in personal remittances received worldwide in 2025. India accounts for $150.712 billion, followed by Mexico at $65.087 billion. France, the Philippines and Egypt each received more than $41 billion. This updates the older 2022 picture rather than presenting it as current. The extract was checked on 9 November 2026 and reports a database update of 8 October. [1]
India’s share of the world total is about 16.3%, calculated from the same-year country and world observations. Its receipts are more than twice Mexico’s. The graphic preserves the twelve largest reported recipients separately and groups the remainder by region; the downloadable table keeps all 132 economies with a non-missing 2025 value.
These are nominal dollar flows over a year, not wealth held by households at a point in time. A larger dollar total can reflect more transfers, larger transfers or exchange-rate effects. It does not automatically mean that each receiving family can buy more.
Why France appears near the top
The statistical definition is broader than the everyday image of a migrant sending part of a salary to relatives. UNCTAD explains personal remittances as the combination of personal transfers between resident and non-resident households and compensation of employees, including workers employed in economies where they are not resident. [3]
That definition helps explain why high-income economies can appear high in the table. The recipient country is an accounting location, and cross-border labour income can matter. We should not assume every dollar in the series represents a transfer from a long-term emigrant to a poorer family.
The country totals also do not identify the sending country. India’s receipt figure cannot tell us how much came from the United States, the Gulf or Europe. That requires a separate bilateral or survey dataset. A world receipt chart should not draw country-to-country arrows without that additional evidence.
The largest total is not the deepest dependence
Look at remittances relative to GDP and smaller economies move to the front. The World Bank’s 2025 series puts receipts at 57.7% of GDP in Tajikistan, 39.3% in Tonga and 32.3% in Nepal. Honduras records 30.1% and El Salvador 27.5%. These ratios describe the scale of cross-border receipts relative to annual domestic production. [2]
They do not mean that remittances are a component of GDP of that size. GDP measures production within the economy, while these receipts are cross-border income and transfers. Nor does a national ratio say that the same percentage of every household’s income comes from abroad. Some households receive nothing, while others may rely on relatives overseas.
The distinction between total volume and relative exposure is useful for readers. A large recipient can be important to the global transfer market; a smaller recipient can be much more exposed if those flows weaken. Both comparisons belong beside each other, with their denominators visible.
Fees reduce the amount that reaches home
The World Bank’s Remittance Prices Worldwide site reports a global average cost of 6.36% for sending $200 in its third-quarter 2025 reporting. On a $200 example, that is $12.72. It is a surveyed average, not a current quote available to every sender. The route, provider, payment method and exchange-rate margin can change the actual price. [4]
The cost series and the receipt series answer separate questions. We do not deduct a blanket 6.36% from the world receipt total: the pricing survey covers a standard transfer amount and a set of services, while the balance-of-payments series covers recorded annual flows. Treating one as a universal fee on the other would invent a calculation the data cannot support.
Timing also needs attention. India’s central bank reports personal transfer receipts of $43.5 billion in the January–March quarter of financial year 2025–26, up from $33.9 billion a year earlier. That is useful recent context, but it uses a different period and measure from the World Bank’s calendar-year 2025 personal-remittance total. We keep it separate. [5]
The story behind the world total is a set of household and labour connections crossing borders. The strongest reading keeps three numbers distinct: how much an economy receives, how large that flow is relative to its economy, and what senders pay to move the money.