The familiar destinations are not the whole story
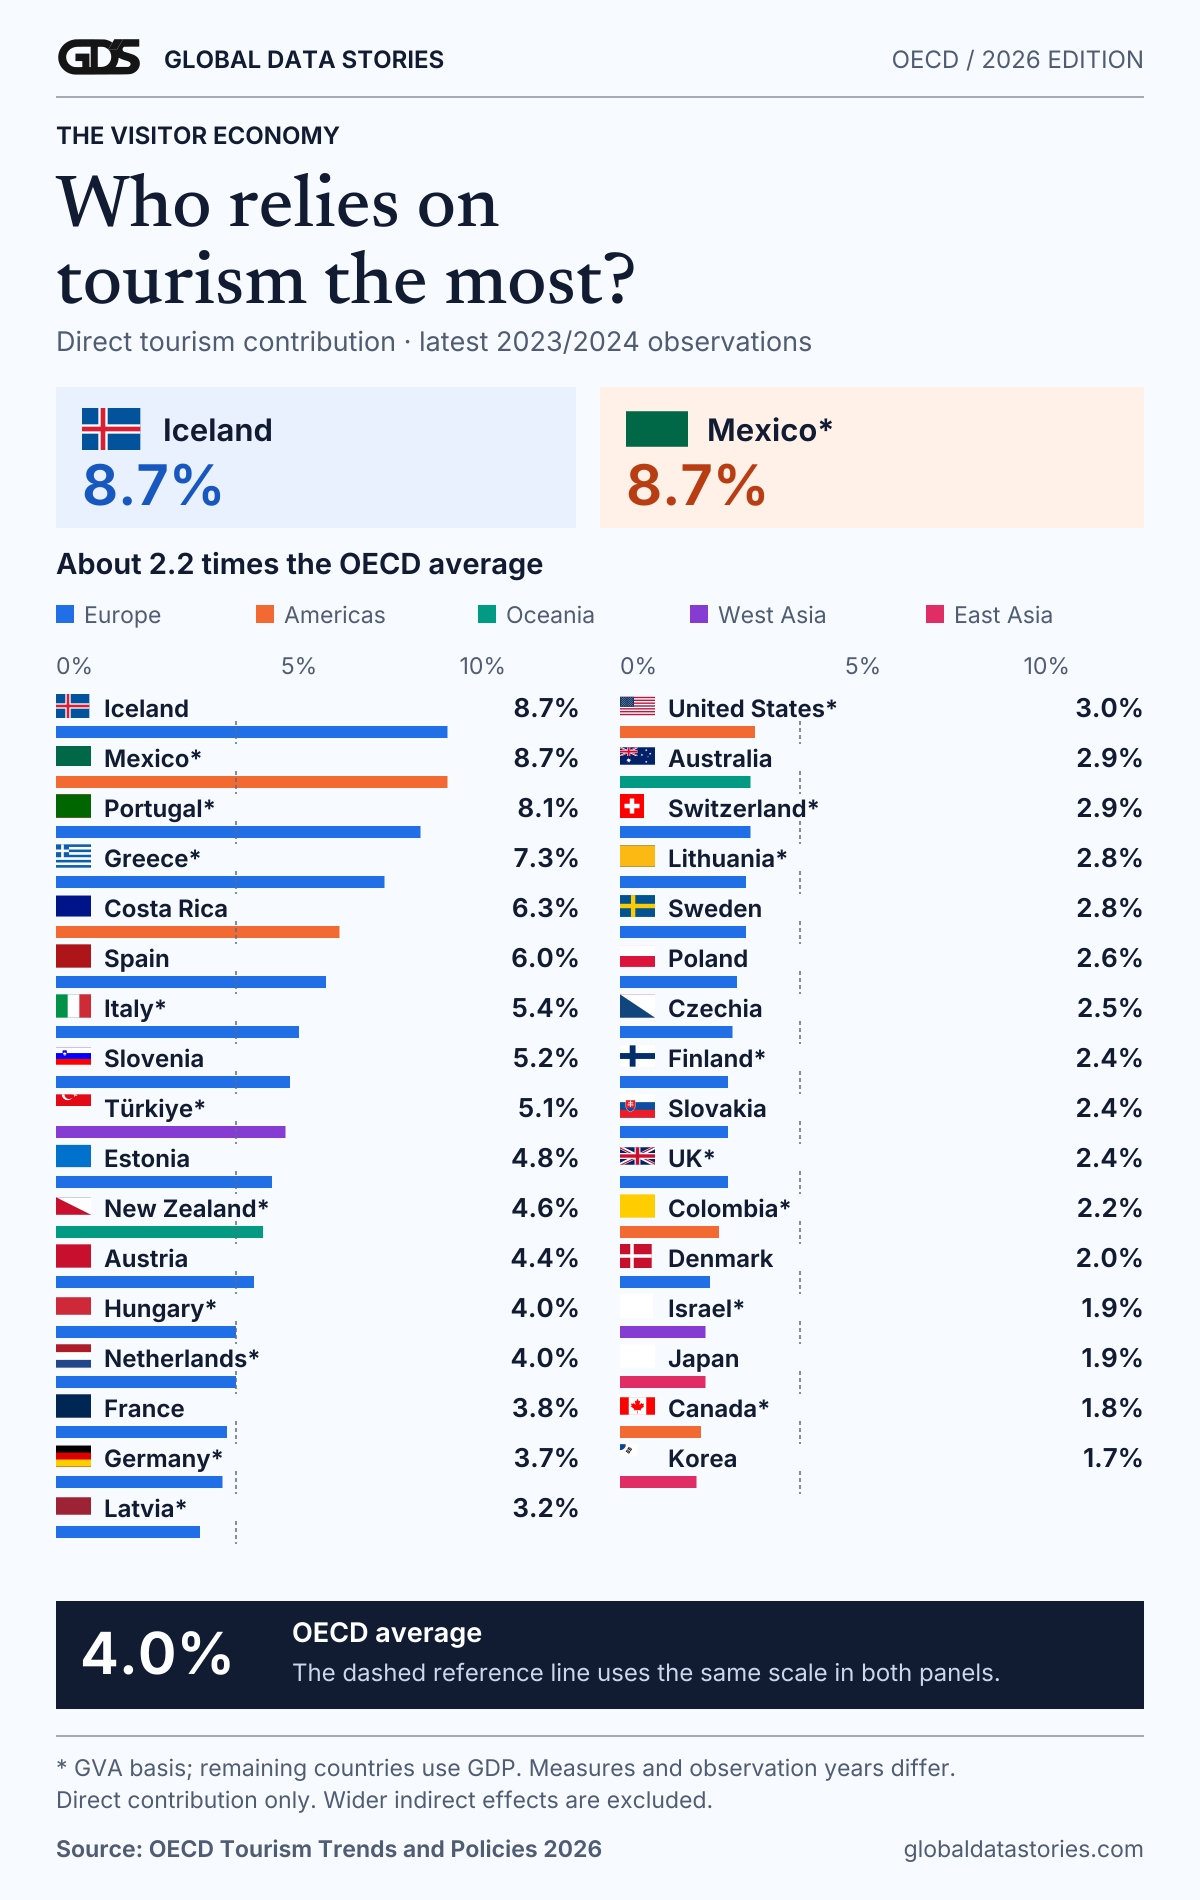
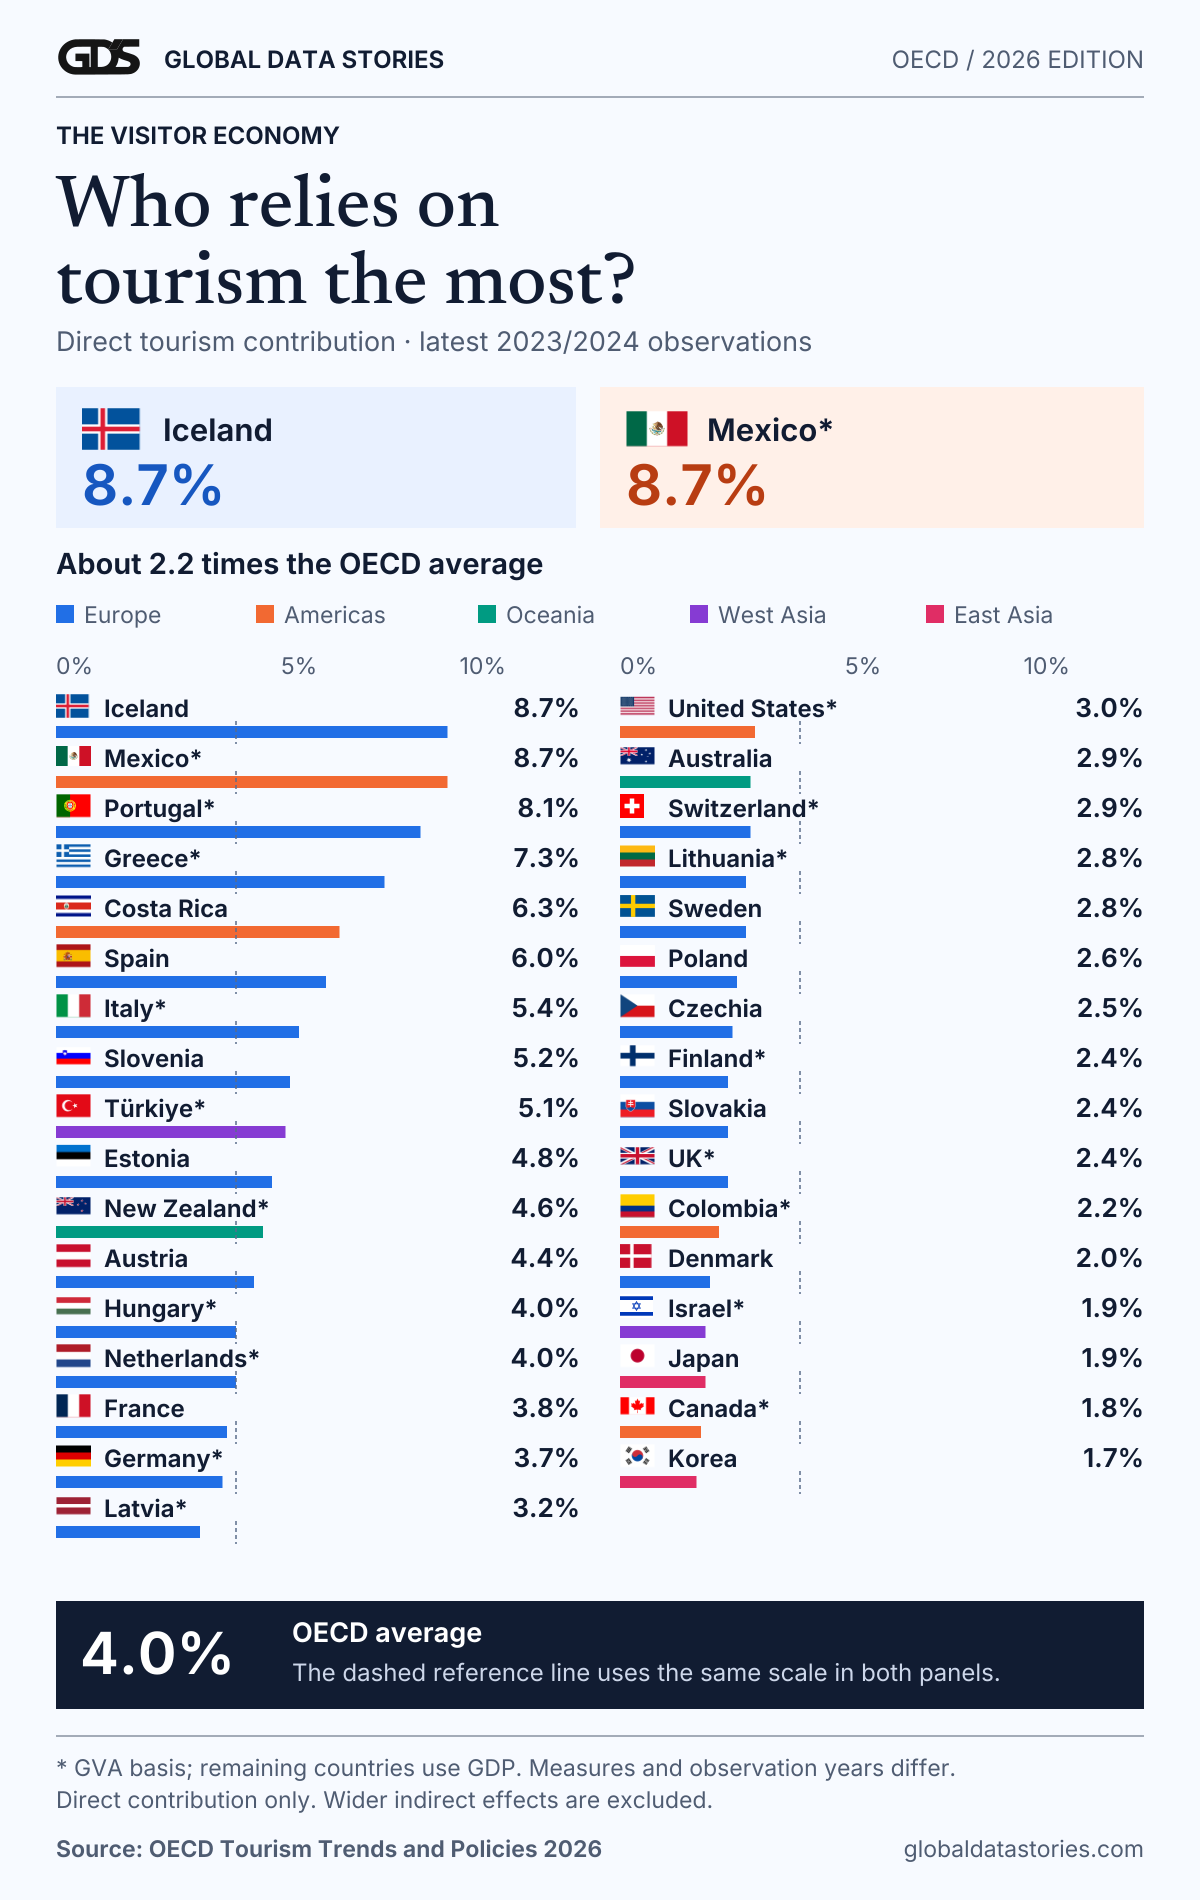
Mexico and Iceland sit at the top of the OECD’s 2026 comparison, each with a direct tourism contribution of 8.7%. Portugal follows at 8.1%, Greece at 7.3% and Costa Rica at 6.3%. The OECD average is approximately 4.0%. These are the latest available 2023 or 2024 observations for 33 member countries, rather than measurements of tourism in 2026. [1]
The chart asks a different question from a list of the world’s most visited destinations. A large economy can welcome millions of visitors while tourism remains a modest share of its total output. A smaller economy can depend much more heavily on a smaller number of trips. The denominator—the size of the economy—changes the story.
This is also an OECD comparison, not a world ranking. It cannot identify the most tourism-dependent country on Earth. Many small island destinations are outside the displayed group, and countries without a qualifying observation are not represented.
Direct contribution is not the entire tourism economy
Tourism is measured across several activities rather than one neatly separated industry. Visitors buy accommodation, meals, transport, entertainment and goods. Tourism satellite accounts identify the production associated with that demand. The OECD prefers direct tourism GDP but uses gross value added, or GVA, for the countries marked in our table. GDP and GVA differ in their treatment of taxes and subsidies on products. [1]
A direct measure does not add every supplier effect. A hotel buying food from a farm supports activity upstream, but that is a different accounting layer. Combining a direct contribution for one country with a direct-plus-indirect estimate for another would make the ranking misleading.
Portugal provides a particularly clear example. Its preliminary 2025 satellite account puts directly generated tourism GVA at €21.473 billion, or 8.1% of national GVA. A broader direct-and-indirect contribution is €36.169 billion, equivalent to 11.8% of GDP. Tourism consumption is larger again, at €49.350 billion or 16.1% of GDP. These are three perspectives on the same activity, not three competing answers to one identical question. [4]
Mexico and Iceland: the same share, different exposure
Mexico’s statistical office, INEGI, reports tourism GDP of 2.713 trillion pesos in 2024, equivalent to 8.7% of the national economy in its satellite account. The absolute size of that activity matters alongside the percentage: the ratio alone cannot tell a reader how much income, infrastructure or employment is involved. [2]
Iceland’s OECD profile reports a direct contribution of ISK 400 billion in 2024, also 8.7% of GDP. Travel receipts represented 45.6% of services exports. Iceland then welcomed about 2.3 million international visitors in 2025, with the United States accounting for 29.2%, the United Kingdom 10.1% and Germany 6.7%. Those source markets help describe where external demand comes from. [3]
The identical 8.7% headline therefore does not imply identical vulnerability. A country’s exposure also depends on the balance between domestic and international travel, the concentration of its source markets, seasonality and the capacity of local businesses to serve other customers. The chart measures the sector’s direct economic weight; it does not provide a complete risk score.
What a higher share means for everyday life
A strong visitor economy can support employment and businesses that might struggle on local demand alone. It can also put pressure on housing, transport and public spaces when demand concentrates in a few places or months. Those outcomes need local evidence: a national share cannot tell us whether a particular town has spare capacity or is overcrowded.
For a resident or policymaker, the useful follow-up is not simply whether tourism should be bigger. It is how much value stays locally, whether work is available throughout the year, and whether infrastructure can handle peak demand. A country can grow visitor spending without pursuing the highest possible number of arrivals.
The newer Portuguese figures are discussed separately rather than inserted into the OECD bars. That preserves the report’s published comparison while giving readers a 2025 update. As new satellite accounts appear, the whole comparison should be refreshed with its dates and definitions intact.