The big three occupy half the picture
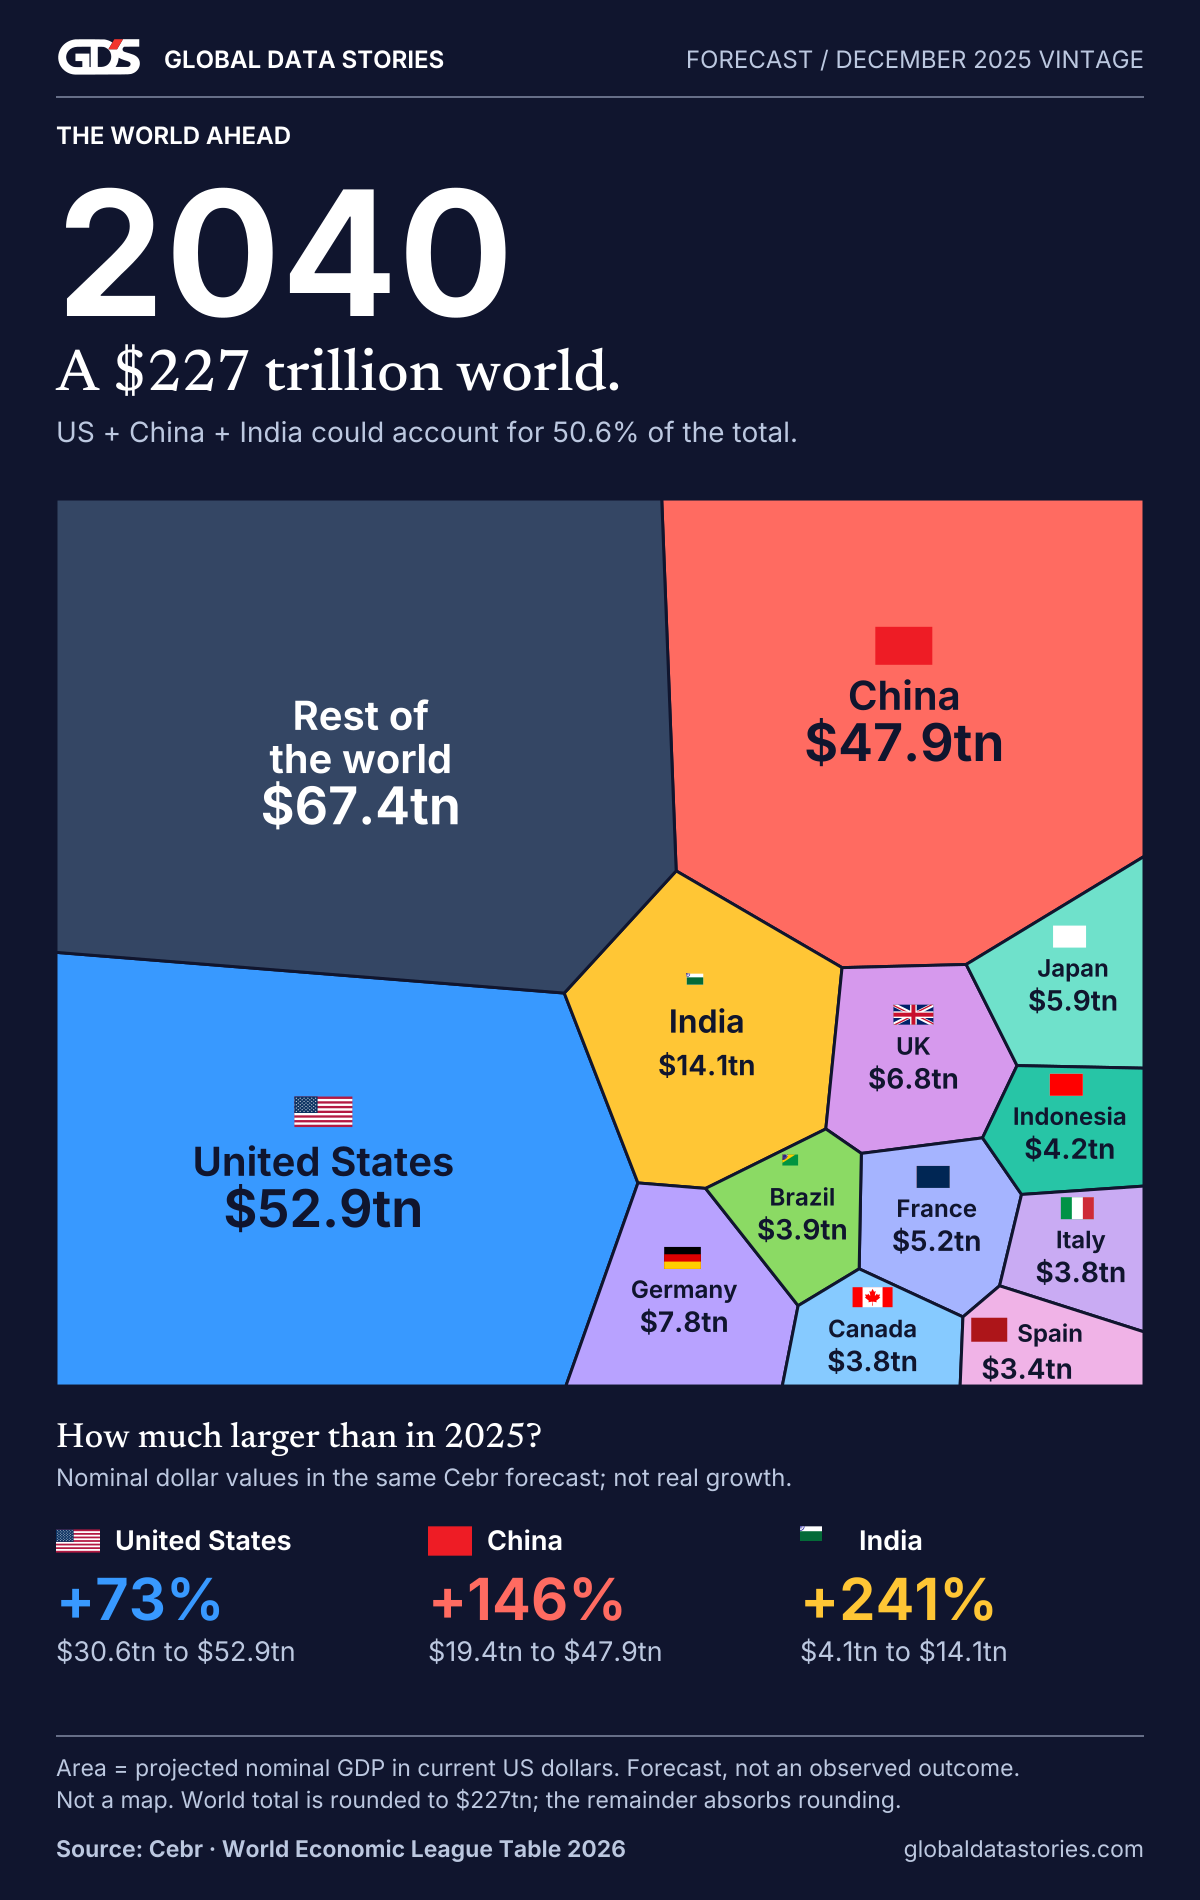
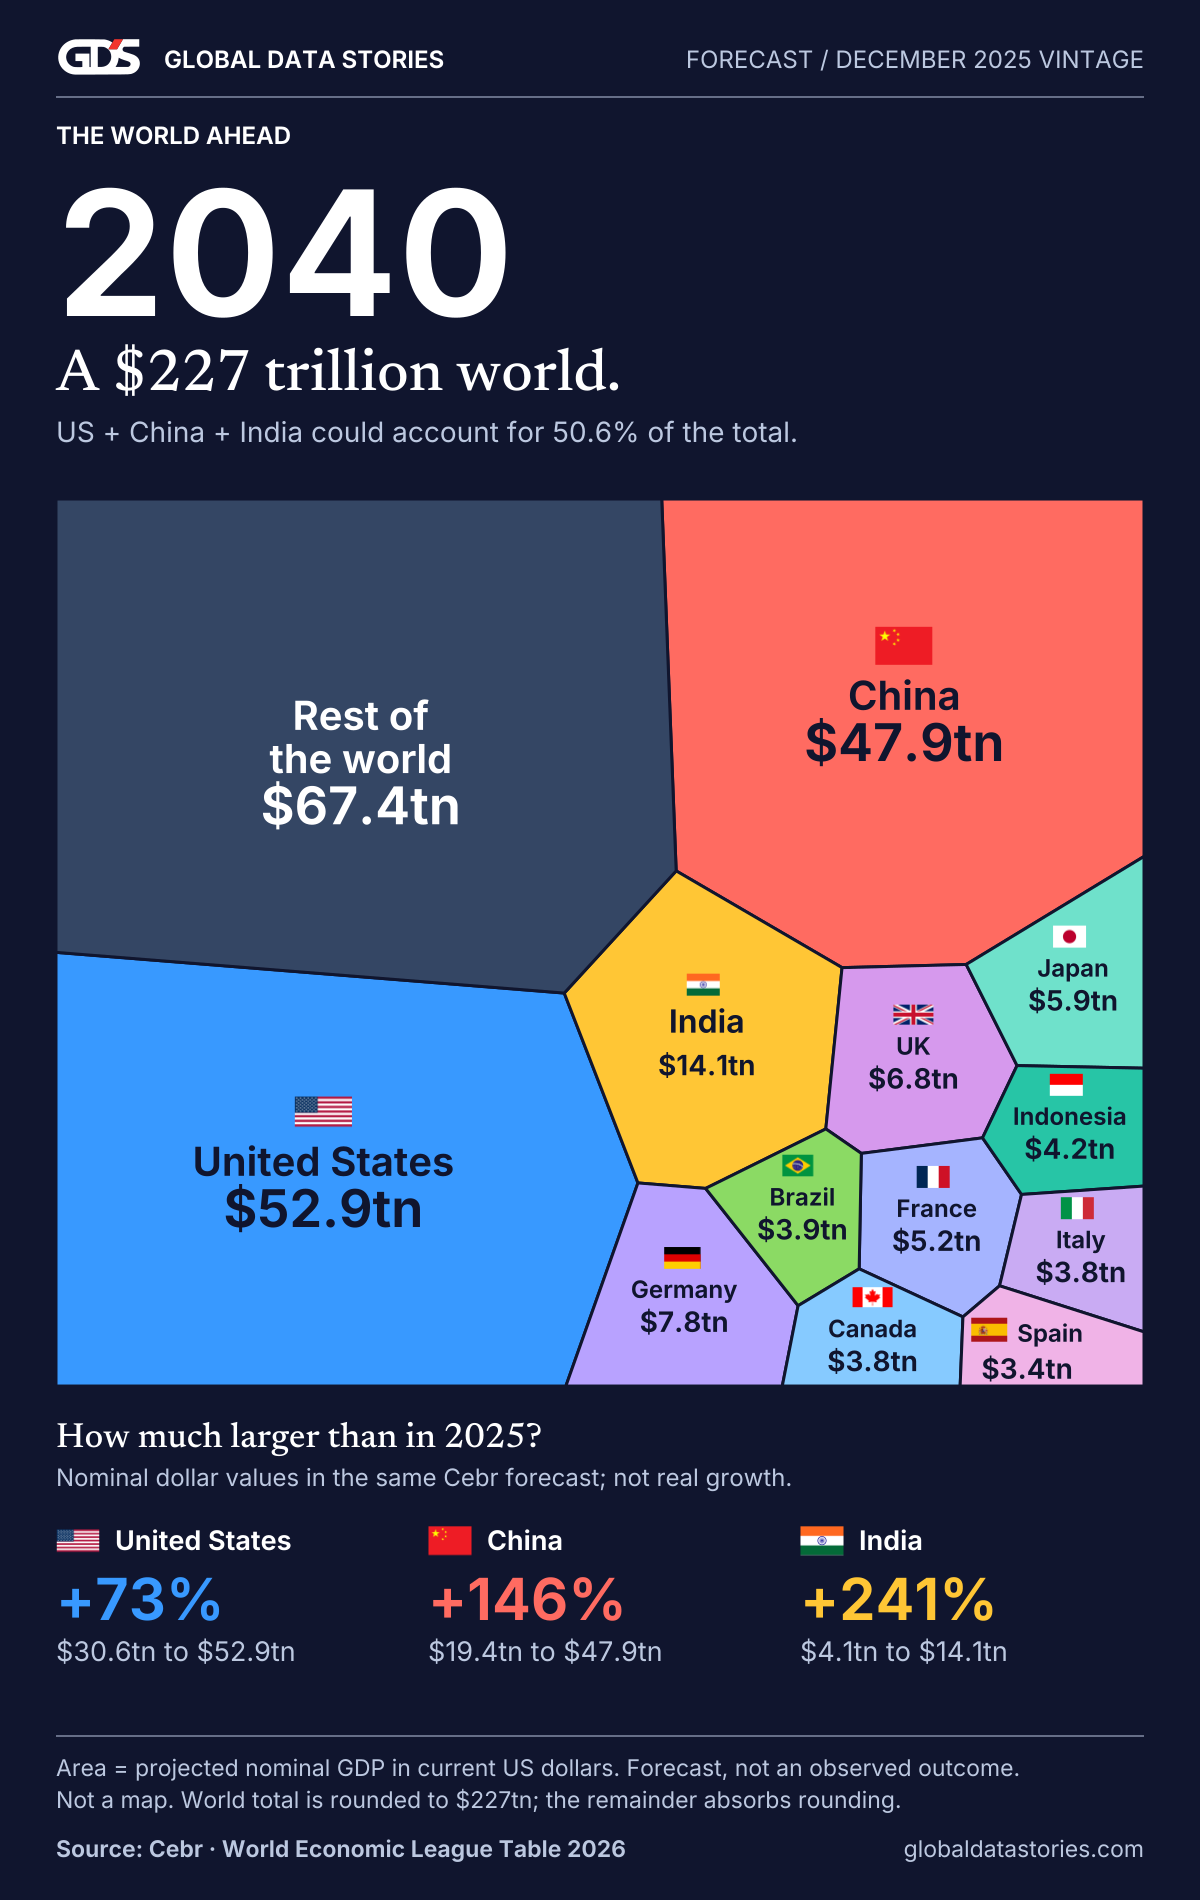
Cebr’s World Economic League Table 2026 projects a world economy of approximately $227 trillion in 2040. Its country tables put the United States at $52.852 trillion, China at $47.877 trillion and India at $14.092 trillion. Together they total $114.821 trillion, about 50.6% of that rounded world total. This is a forecast published in December 2025, not an observed result or a new November 2026 prediction. [1]
The graphic gives each economy an area proportional to its projected output. Geography is deliberately absent: a larger polygon means a larger GDP in this forecast, not a larger land mass. Twelve economies are shown individually and the rest are combined. That makes the concentration visible without reducing dozens of smaller labels to unreadable text.
Which positions change?
In Cebr’s projection, the United States remains first and China second in 2040. India rises to third, ahead of Germany. The United Kingdom reaches fifth and Japan sixth. Indonesia reaches eighth, while Brazil and Canada complete the top ten. These are positions within one forecasting model and one GDP definition. [1]
The interest lies in both scale and movement. A country can expand substantially yet fall in rank if another grows faster in nominal dollar terms. Equally, moving up a place does not tell us how much living standards improved. Rankings discard the distance between neighbours, which is why our data table also shows the projected amounts.
The model is a useful way to organise questions about the future, but it cannot remove uncertainty about productivity, policy, population, inflation or currencies. A precise-looking dollar figure represents the output of assumptions. It should not be read as a promise.
Nominal dollars do not measure real growth
GDP measures the value of final goods and services produced within an economy over a period. Nominal GDP uses the prices of that period. Real GDP adjusts for price changes so that growth in the volume of production can be considered separately. The IMF’s explanation makes that distinction central to interpreting an economy’s expansion. [2]
Consider a simple illustration, not a forecast: an economy produces exactly the same goods and services as last year, but all relevant prices rise by 10%. Its nominal output would rise by 10% even though its real production has not increased. If that output is then expressed in dollars, an exchange-rate change can alter the dollar figure again.
That is why the size of the 2040 total cannot be described as an equivalent increase in real prosperity. Comparing a future current-dollar number with today’s current-dollar number combines changes in production, prices and currency conversion. Our table calls its calculated increase a change in nominal value, not a real growth rate.
A different conversion changes the comparison
Market-exchange-rate GDP is useful when comparing economies in a common traded currency. Purchasing power parity, or PPP, instead uses conversion factors designed to account for differences in prices between countries. The World Bank explains that PPP comparisons aim to put real volumes on a more comparable basis rather than simply translating at market rates. [3]
Neither a large nominal economy nor a large PPP economy automatically makes its typical resident wealthy. Population matters, and the distribution of income matters. GDP per person adds one useful denominator, but it is still an average and does not measure how evenly the benefits are shared. The IMF also notes that GDP is not a complete measure of well-being. [2]
A reader interested in household living standards should therefore pair this chart with income, consumption, health, housing and distribution measures. The map of economic power and the experience of a typical household are connected, but they are not interchangeable.
Keep the forecast vintage in view
There is newer near-term information. The IMF’s October 2026 World Economic Outlook projects global real growth of 3.1% in 2026 and 3.4% in 2027. Those figures provide current context, but they do not validate Cebr’s 2040 country values: they come from another institution, use a different horizon and measure real growth rather than future nominal dollar size. [4]
We have kept the Cebr series intact instead of blending newer short-term forecasts into an older long-range model. Updating a 2040 outlook requires recalculating the model consistently, not replacing a convenient starting value in a graphic.
The enduring question is how concentrated global production may remain even as individual countries change places. In this scenario, the largest three economies account for roughly half of output. The exact boundaries will move as assumptions and evidence change; the concentration is what the picture invites us to examine.