
The scale of the solar buildout
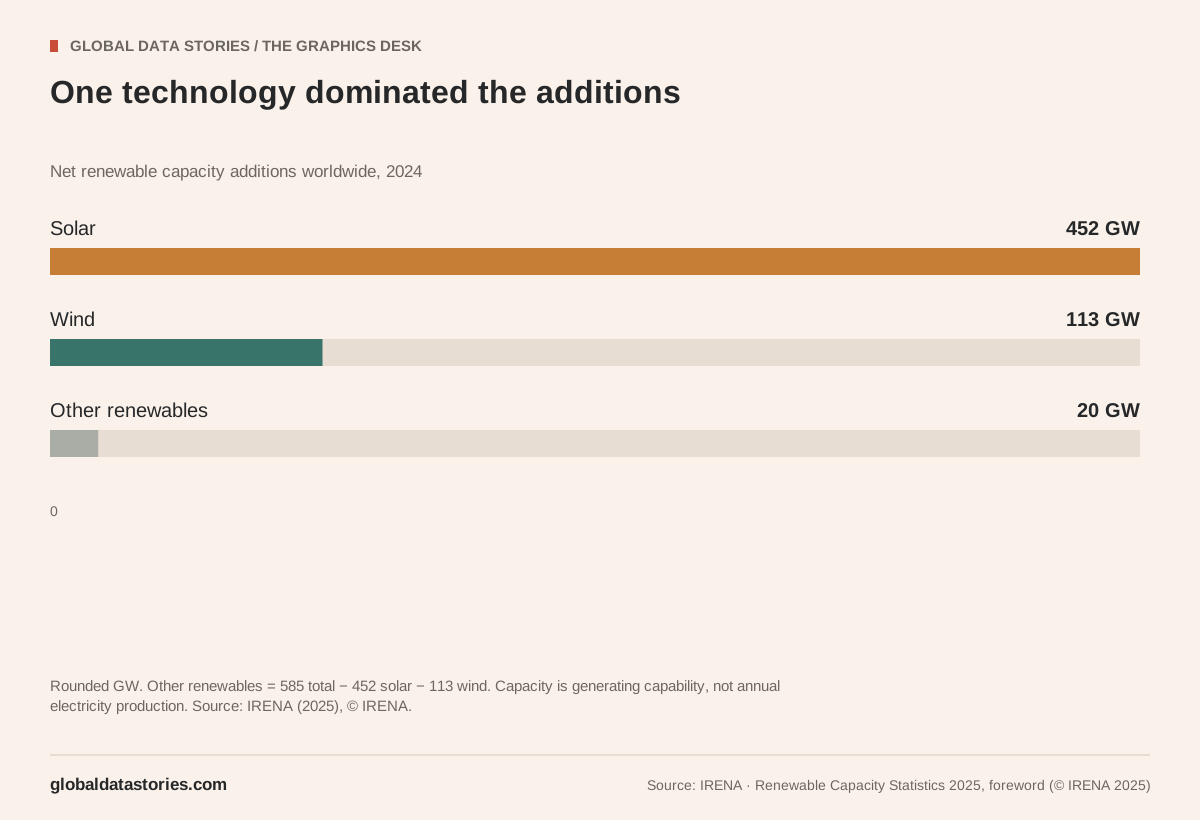
The world added 585 gigawatts of renewable generating capacity in 2024, according to IRENA's Renewable Capacity Statistics 2025. Solar accounted for 452 GW and wind for 113 GW. Together, they made up almost all of the increase.
Using those rounded figures, solar represents about 77% of the total. The remaining 20 GW in the chart groups the other renewable technologies; it is a subtraction, not a separate precise measurement.
Capacity is not generation
A gigawatt measures power. It tells us about the generating capacity installed, not the electricity delivered across a year. To measure that output, we need energy units such as gigawatt-hours or terawatt-hours.
Ember's separate review of 2024 generation shows the difference. Solar supplied 6.9% of global electricity, while hydro supplied 14.3%. A technology can dominate new construction without yet dominating the existing electricity supply.
The buildout was uneven
IRENA reports that China, the United States and the European Union together accounted for 83.6% of new renewable capacity. Africa accounted for 0.7%.
The world total is therefore only the opening view. Where capacity is built, how much it produces and whether it can connect to the grid are separate questions. This chart covers the first step: how much generating capability was added.